The Story of Ultraflow: Designing with Unity Analytics


This story was written by our intern Eric Tsai
In June 2014, 5 students studying at Supinfogame, located in France, came together to prove that “one simple mechanic with only three flat shapes can make a cool, fun and ‘addictive’ game”. ULTRAFLOW was released on Dec. 23. 2014. ULTRAFLOW is a minimalist yet complex puzzle game based on agility. The objective is simple: shoot a ball so that it bounces through obstacles within a limited number of bounces.
Almost two months since launching, it hadn't made much noise. “We were frustrated,” says one of the level designers, Gautier Tintillier. “We had plenty of playtests to make sure our levels were well designed before launching; everything was ready. There must be a roadblock we overlooked that turns the players away; we just didn't have an easy solution to find it.”
Being a team of five, they lacked the human and computing resources to collect, analyze and pinpoint which part of the game might be turning away players. Unity Analytics turned out to be the perfect solution.
“We are game design students at Supinfogame. Our priority was to design and develop games; it would take way too much of our focus to build an infrastructure for data collection. We have thought about using other services, but since our game is already built on Unity, it was effortless to integrate Unity Analytics into our game to get all the metrics we need,” says the developer, Thibaud Troalen.
Activated by a simple switch, games made with Unity log their players’ actions such as session length, frequency of play, and any custom events the developer defines. This data is aggregated into a dashboard which visualizes important factors, such as engagement and retention.
Ultrateam, the developers behind ULTRAFLOW, noticed Day One retention was good, but the figures showed a big drop off by Day Three. The sticky factor (metric to measure how ‘sticky’ the game is using duration of game play and frequency of opening the game) was also low.
Using the Funnel Analyzer, they identified that 7% of players left the at level 9. They also noticed that the average retries increased 3X from the previous level. They concluded that level 9 is frustrating new players and started working on redesigning it.

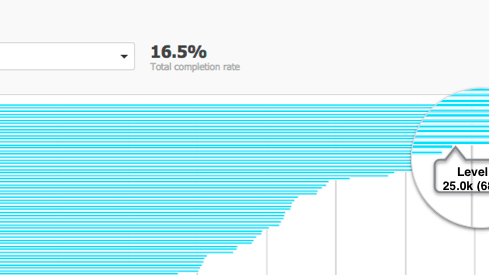
“The result was stunning”, said Thibaud. “I didn’t think a simple change like this would have such a huge effect.” The effect of adjusting the difficulty was dramatic and immediate: the 7% drop off was completely eliminated (now there is only .8% drop off at level 9) They had a total of 10% increase in the proportion of users who finish all 99 levels in the two weeks span after the adjustment. The durations increased by 10% on average and number of retries at higher levels increased as well. While these changes might seem small, the result was that a game that had very little traction during the first three months, spiked up the rankings in the app stores.
“I’m sure there are tons of developers facing the same problems that we face. As a game designer from a small studio, we focus most of our time on graphics, music, and gameplay. We know analytics can really help us build a better game, but we don’t really have additional resources to handle the backend data infrastructure. It was really cool to see how easy getting the data we need from Unity Analytics is and how powerful insights we could get,” says Gautier. “With Unity Analytics, we were able to have a 360 view on the in and outs of our game. We know who is playing, which segment of users were having difficulty, who kept playing, where they came from, which levels were too difficult, where are our players dropping off. It opens up so many opportunities for us to improve our game and improve our players’ experience.”
What’s next for these 5 students from France?
“We are getting ready to launch a new game,” says Thibaud. “It will be similar to ULTRAFLOW, but with lots of variations and improvements using insights we learned from Unity Analytics. With the availability of data, we can rely on statistics and really tailor the game to our players. We plan to incorporate more insights that Unity Analytics offers and really leverage analytics to maximize the user experience”.
Funnel Analyzer is only one of the many data visualization tools that Unity Analytics offers; this is a sneak peak at the power of Unity Analytics and how it transform a quality game into a popular game. With Unity Analytics, indie developers like Ultrateam do not need to spend additional resources on building and maintaining the infrastructure for data collecting and analysis; instead, they can focus on what they enjoy and do the best: design and engineer amazing games.
Team Ultrateam includes Thibaud Troalen (Developer), Franck Fitrzyk (Level Designer),Gautier Tintillier (Level Designer), Maxime Bondoux (Sound Designer) and Theophile Loaec (Sound Designer).
Is this article helpful for you?
Thank you for your feedback!
- Unity Labs
- Copyright © 2024 Unity Technologies