Performance benchmarking in Unity: How to get started


As a Unity developer, you want your users to love playing your games, enjoying a smooth experience across all the platforms they may play on. What if I told you that we just made it easier to create performance benchmarks? If you want to learn how to develop games or Unity tools with an eye on performance, please read on!
In this post, I explain how to use a couple of Unity tools that give you an easy way to start collecting performance metrics and creating benchmarks with them: the Unity Test Runner that ships with the Unity Editor, the Unity Performance Testing Extension, and the Unity Performance Benchmark Reporter.
Why Benchmark Performance in Unity?
As a Unity Developer, you might find yourself in the following situation: your project was running fast and smooth not too long ago, but then one or more changes have come in, and now scenes are noticeably slow, frames are dropping, and other performance issues have started popping up. Tracking which changes led to the performance regression can be difficult.
If you’re a Unity Partner, you want to understand the performance changes across your SDKs, drivers, platforms, packages, or other artefacts. Or you’d like to collect performance metrics across different versions of Unity with your products, but it’s not very clear how to do this and then make the comparisons.
Those are just a couple of examples where establishing performance benchmarks can really save the day. Now, let me show you how you can start collecting performance metrics, create benchmarks with them, and visualize changes in performance metrics.


Download the Sample Project
For this discussion, we’ll be looking at the test code in the UnityPerformanceBenchmark sample performance test project.
Download the latest XRAutomatedTests release from GitHub. You’ll find the UnityPerformanceBenchmark project in the PerformanceTests subdirectory.
Writing Performance Tests in Unity Test Runner
The UnityPerformanceBenchmark project contains a variety of sample scenes that are in turn used in Unity Performance Tests using the Unity Performance Testing Extension.
The first thing we’re going to do is take a look at how we write performances test using the Unity Test Runner with the Unity Performance Testing Extension. Here is a bit of background info on both of these tools before we proceed.
Unity Test Runner
We’re using the Unity Test Runner to run our performance tests. The Unity Test Runner is a test execution framework built into the Unity Editor allowing you to test your code in both Edit and Play mode on target platform players such as Standalone, Android, or iOS. If you aren’t familiar with the Unity Test Runner, check out the Unity Test Runner documentation.
Unity Performance Testing Extension
The Unity Performance Testing Extension is a Unity Editor package that provides an API and test case attributes allowing you to sample and aggregate both Unity profiler markers and non-profiler custom metrics, in the Unity Editor and players. You can learn more by checking out the Unity Performance Testing Extension documentation, but we’re going to look at some examples here.
The Unity Performance Test Extension requires Unity 2018.1 or higher. Be sure to use Unity version 2018.1 or higher if you want to run the sample performance tests in the UnityPerformanceBenchmark project or whenever you are using the Unity Performance Test Extension.
Open the Sample Project Using the Command Line
The UnityPerformanceBenchmark project implements the IPrebuildSetup interface, a Unity Test Runner facility, where we can implement a Setup method that is automatically called before the test run is executed by the Unity Test Runner.
The first thing the UnityPerformanceBenchmark project’s IPrebuildSetup.Setup method does is parse the command line arguments looking for player build settings. This allows us to flexibly build the player for our performance tests using the same Unity project against different platforms, render threading modes, player graphics APIs, scripting implementations, and XR-enabled settings such as stereo rendering path and VR SDKs.
Thus, we’ll need to open the UnityPerformanceBenchmark project with Unity from the command line, passing in the player build options we want to use when we run the tests in the Unity Test Runner.
Example: Launch UnityPerformanceBenchmark project from Windows to Build Android Player:
Unity.exe -projectPath
C:\XRAutomatedTests-2018.2\PerformanceTests\UnityPerformanceBenchmark
-testPlatform Android -buildTarget Android -playergraphicsapi=OpenGLES3 -mtRendering -scriptingbackend=mono
Here we launch Unity on Windows to build for Android with OpenGLES3 graphics API, multithreaded rendering, and mono scripting backend.
Example: Launch UnityPerformanceBenchmark project from OSX to Build iOS Player
./Unity -projectPath /XRAutomatedTests-2018.2/PerformanceTests/UnityPerformanceBenchmark
-testPlatform iOS -buildTarget iOS -playergraphicsapi=OpenGLES3 -mtRendering -scriptingbackend=mono
-appleDeveloperTeamID=<yourAppleDeveloperTeamID>
-iOSProvisioningProfileID=<yourIosProvisionProfileID>
Here we launch Unity on OSX to build for iOS with OpenGLES3 graphics API, multithreaded rendering, and mono scripting backend. We also provide the Apple developer team and provisioning profile information needed to deploy to an iOS device.
When we open the UnityPerformanceBenchmark project with Unity from the command line like in the examples above, the command line args will be in memory for the IPrebuildSetup.Setup method to parse and use to build the player with.
While this launch-from-command-line approach isn’t required to run tests in the Unity Test Runner, it’s a good pattern to use to avoid using a separate test project for each player configuration.
I’ve detailed the command line options for opening the project, or just running the tests, from the command line on the wiki for the test project: How to Run the Unity Performance Benchmark Tests. To learn more about how we’re parsing the player build settings in the test project, take a look at the RenderPerformancePrebuildStep.cs file in the Scripts directory of the UnityPerformanceBenchmark test project.
Open the Test Runner Window
After we open the UnityPerformanceBenchmark, we need to open the Unity Test Runner window in the Unity Editor
- in Unity 2018.1, go to Window > Test Runner.
- in Unity 2018.2, go to Window > General > Test Runner.
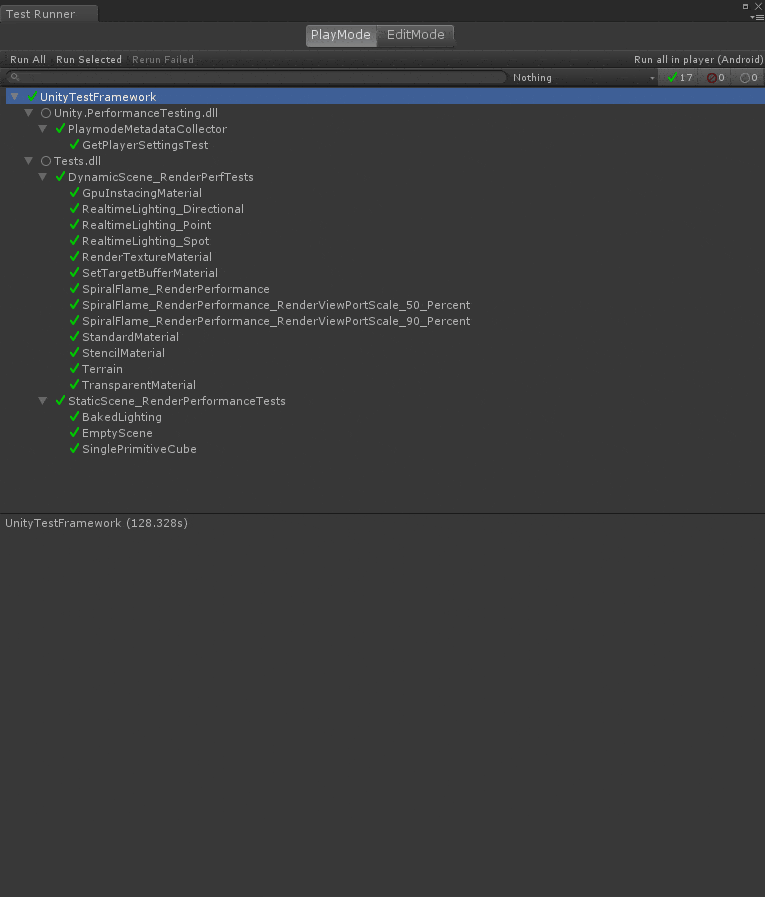
The Unity Test Runner window will open and look like the image below.


These are our Unity Performance tests. We can run them in the Editor using the Run button at the top left of the window, or on the actual device or platform using the “Run all in player” button at the top right of the window.
Debugging Tip
If you want to debug code in your IPrebuildSetup.Setup method
- Set breakpoints in your IPrebuildSetup.Setup code in Visual Studio
- Attach to the Unity Editor with the Visual Studio Tool for Unity extension
- Run your tests in the Editor using the “Run All” or “Run Select” button in the Unity Test Runner window.
At this point the Visual Studio debugger will break into your code where you can debug as needed.
Example Unity Performance Test
Let’s take a look at a performance test example so we can get a better understanding of how it works.
Example: Sampling Profiler Markers in a Unity Performance Test
[PerformanceUnityTest]
public IEnumerator SpiralFlame_RenderPerformance()
{
	yield return SceneManager
			.LoadSceneAsync(spiralSceneName, LoadSceneMode.Additive);

	SetActiveScene(spiralSceneName);

	// Instantiate performance test object in scene
	var renderPerformanceTest =
		SetupPerfTest<DynamicRenderPerformanceMonoBehaviourTest>();

	// allow time to settle before taking measurements
	yield return new WaitForSecondsRealtime(SettleTime);

	// use ProfilerMarkers API from Performance Test Extension
	using (Measure.ProfilerMarkers(SamplerNames))
	{

		// Set CaptureMetrics flag to TRUE;
		// let's start capturing metrics
		renderPerformanceTest.component.CaptureMetrics = true;

		// Run the MonoBehaviour Test
		yield return renderPerformanceTest;
	}

	yield return SceneManager.UnloadSceneAsync(spiralSceneName);
}
In this example, our test method is called SpiralFlame_RenderPerformance. We know from the method decorator [PerformanceUnityTest], that this is a Unity Performance Test.
All of the tests in the UnityPerformanceBenchmark test project follow the same pattern we see in this test method:
- Load the scene for the test
- Set the scene as active so we can interact with it in the test method
- Create a test object of type DynamicRenderPerformanceMonoBehaviourTest and add it to the test scene (this happens in SetupPerfTest<T> method)
- Wait for a constant value of time for the scene to “settle” after loading and adding the test object to the scene before we start sample metrics.
- Setup our profiler markers for capture by the Performance Test Extension API
- Let the performance test know we’re ready to start capturing metrics
- Then yield return the test object (an IMonoBehaviourTest) to capture metrics during the rendering loop.
We also sample custom metrics (metrics that don’t fall into one of Unity profiler markers, framecount, or execution time) in the RenderPerformanceMonoBehaviourTestBase base class (this class inherits from MonoBehaviour).
Example: Sampling Custom Metrics in a Monobehaviour Script
private void Update()
    {
        if (CaptureMetrics)
        {
            FrameCount++;
            SampleFps();
#if ENABLE_VR
            if (XRSettings.enabled)
            {
                SampleGpuTimeLastFrame();
            }
#endif
        }

        if (IsMetricsCaptured)
        {
            EndMetricCapture();
        }
    }
private void SampleFps()
{
	Fps = GetFps();
	Measure.Custom(FpsSg, Fps);
	startFrameCount = Time.renderedFrameCount;
}
private void SampleGpuTimeLastFrame()
{
var gpuTimeLastFrame = GetGpuTimeLastFrame();
Measure.Custom(GpuTimeLastFrameSg, gpuTimeLastFrame * 1000);
}public void EndMetricCapture()
{
CaptureMetrics = false;
#if UNITY_ANALYTICS && UNITY_2018_2_OR_NEWER
Measure.Custom(startupTimeSg, appStartupTime);
#endif
}In the example above, we’re capturing FPS, GpuTimeLastFrame (if XR is enabled), and application startup time (if Unity Analytics is enabled and we’re running on Unity 2018.2-or- newer where the API we need is available).
IsTestFinished Property
Finally, notice in the same RenderPerformanceMonoBehaviourTestBase base class that we have implemented a property public bool IsTestFinished.We’re required to implement this property because our RenderPerformanceMonoBehaviourTestBase implements the IMonoBehaviourTest interface.
This property is important because the Unity Test Runner uses it to know when to stop the test. When it’s value is true, the test ends. It’s up to you to implement the logic you want in order to determine when the Unity Test Runner should stop running the test.
Example: Sampling Custom Metrics in the IsTestFinished Property
public bool IsTestFinished
{
	get
	{
		bool isTestFinished = false;

		if (IsMetricsCaptured)
		{
			Measure.Custom(objCountSg, RenderedGameObjects);
			Measure.Custom(trianglesSg, Tris);
			Measure.Custom(verticesSg, Verts);
			isTestFinished = true;
		}

		return isTestFinished;
	}
}
In this final example, we’re capturing the number of rendered game objects, triangles, and vertices in the scene when the test finishes.
SampleGroupDefinition
Now that we’ve seen some examples of how we make calls into the Performance Testing Extension to sample metrics, let’s talk about how we configure these to begin with.
The Measure.* methods generally take a struct as a parameter called a SampleGroupDefinition. When we create a new SampleGroupDefinition we define some properties for the samples we are interested in collecting.
Example: Define new SampleGroupDefinition for GpuTimeLastFrame, using Milliseconds as the sample unit, aggregate samples using a minimum value
Below is the SampleGroupDefinition for GpuTimeLastFrame. This is how we let the Performance Testing Extension know how to collect samples and aggregate them for GpuTimeLastFrame.
This SampleGroupDefinition is from the dynamic scene render performance test example, so here we’ve chosen to aggregate our samples using the minimum value collected. But why would we do that rather than use a more common aggregation measure, like median or average?
The answer is because the scene is dynamic. In a dynamic scene using a median or average aggregation would be unreliable or inconsistent for the same scene run against the same code given the changing nature of the rendering. This is most likely the best we can do if we want to track a single aggregate for a rendering metric in a dynamic scene. However, when we define a similar SampleGroupDefinition for our static scenes, we definitely use a median aggregation.
new SampleGroupDefinition(GpuTimeLastFrameName, SampleUnit.Millisecond, AggregationType.Min)
Example: Define new SampleGroupDefinition for FPS, using none as the sample unit, aggregate samples using a median value, an increase in the value is better
Below is the SampleGroupDefinition for FPS (Frames Per Second). FPS doesn’t have a separate measurement unit; it’s just FPS, so we specify SampleUnit.None here. We’ll using a median aggregation type here; this is in a static scene so we don’t have to worry about an unpredictable rendering experience. We’re explicitly establishing a 15% threshold for the sample group, and passing true for the increaseIsBetter argument because, if FPS increases, it’s a good thing!
These last two arguments are collected and saved in our performance test results .xml file when running from the command line, and can be later used in the Unity Performance Benchmark Reporter to establish benchmarks.
new SampleGroupDefinition(FpsName, SampleUnit.None, AggregationType.Median, threshold: 0.15, increaseIsBetter: true)
When the test completes, all of the metric samples we enabled earlier are then aggregated by the Performance Testing Extension.
Measurement Types
I want to point out that in our code examples we use a couple of different Unity Performance Testing Extension APIs, namely
- Measure.ProfilerMarkers, and
- Measure.Custom
The Unity Performance Testing Extension provides other Measure methods as well that may suit your specific needs depending on what, and how, you’re wanting to measure performance in Unity. These additional methods include:
- Measure.Method
- Measure.Frames
- Measure.Scope
- Measure.FrameTimes
Learn more about the different Measure methods in the Unity Performance Testing Extension documentation, specifically in the “Taking measurements” section.
Running Performance Tests in Unity Test Runner
Now that we’ve looked at some examples of how we write performance tests using the Unity Test Runner using the Unity Performance Testing Extension, let’s look at how we run them.
There are two primary ways we can execute our performance tests
- From the command line, launching Unity with the -runTests option. This is the preferred way for performance tests because the Unity Performance Test Extension will generate a result .xml file for us that we can use in the Unity Performance Benchmark Reporter to view and compare our results.
- Directly from within the Editor. This is a useful approach if you
a. Just want to run the tests and view the results in the Unity Test Runner window without needing to capture the results for later use, or
b. Want to verify your tests will run or you need to debug into test code.
Running Performance Tests with the -runTests Command Line Option
Here are two examples of how to run performance tests with Unity Test Runner from the command line. These examples should look very familiar, because we’re building off the same examples we saw earlier in our discussion about opening the UnityPerformanceBenchmark project from the command line.
Example: Running the UnityPerformanceBenchmark Performance Tests from Windows against an Android Player
Here we launch Unity on Windows to build for Android with OpenGLES3 graphics API, multithreaded rendering, and mono scripting backend.
Unity.exe -runTests [-batchmode] -projectPath
C:\XRAutomatedTests-2018.2\PerformanceTests\UnityPerformanceBenchmark -testPlatform Android -buildTarget Android -playergraphicsapi=OpenGLES3 -mtRendering -scriptingbackend=mono -testResults
C:\PerfTests\results\PerfBenchmark_Android_OpenGLES3_MtRendering_Mono.xml -logfile
C:\PerfTests\logs\PerfBenchmark_Android_OpenGLES3_MtRendering_Mono_UnityLog.txt
Example: Running UnityPerformanceBenchmark Performance tests from OSX against an iOS Player
Here we launch Unity on OSX to build for iOS with OpenGLES3 graphics API, multithreaded rendering, and mono scripting backend. We also provide the Apple developer team and provisioning profile information needed to deploy to an iOS device.
./Unity -runTests [-batchmode] -projectPath /XRAutomatedTests-2018.2/PerformanceTests/UnityPerformanceBenchmark
-testPlatform iOS -buildTarget iOS -playergraphicsapi=OpenGLES3
-mtRendering -scriptingbackend=mono
-appleDeveloperTeamID=<yourAppleDeveloperTeamID>
-iOSProvisioningProfileID=<yourIosProvisionProfileID> -testResults /PerfTests/results/PerfBenchmark_Android_OpenGLES3_MtRendering_Mono.xml
-logfile /PerfTests/logs/PerfBenchmark_Android_OpenGLES3_MtRendering_Mono_UnityLog.txt
For both of these examples, we’ve introduced three to four new command line options that will help us run our tests instead of just opening the Unity Editor with the command line arguments available to the IPrebuildSetup.Setup method.
-runTests
This option tells the Unity Test Runner that you want to run your tests
-testResults <pathToWritePerformanceTestResultsFile>
This option specifies the filename and path to the .xml file that the Unity Test Runner should save your performance tests results in.
-logfile <pathToWriteUnityEditorLogFile>
This option specifies the filename and path to the file that the Unity Editor should write its logging to. This is optional, but can be really helpful when you’re investigating failures and issues if you can quickly access the Unity Editor log file.
-batchmode
This option will force the Unity Editor to open in a headless mode. We use this option when we are only running player performance tests and there is no need to actually open the Unity Editor window. This can save time during automated tests execution. When this option is not used, the Unity Editor will open on the screen before executing the tests.
At Unity we run our performance tests from the command line, often in batchmode, in our continuous integration system.
Example: Running the UnityPerformanceBenchmark Tests from the Command Line

Running Performance Tests in the Unity Editor
With the Unity Test Runner window open near the top when PlayMode is selected (PlayMode tests run in either the build player or in the playmode window of the Editor), we have
- Run All - click this button to run all tests in the PlayMode tab
- Run Selected - click this button to run the select test or node and all tests beneath it.
- Run all in player - click this to have the Unity Editor build the player type configured in build settings and run the tests there
| Important Requirement |
| Running performance tests prior to version 0.1.50 of the Performance Testing Extension in the Unity Editor from the Test Runner window will not produce a result .xml file needed for the Unity Performance Benchmark Reporter. However, if you're using version 0.1.50 or later of the Performance Testing Extension, a results.xml file will be written to the `Assets\StreamingAssets` project folder.
If you are using a version of the Performance Testing Extension earlier than version 0.1.50 and want to create a result .xml file when you've done your performance tests, you need to run the tests by launching Unity from the command line with the -runTests command line option. Be aware however, that when you're running Unity with the -runTests command line option, the Editor will open and begin running the tests. The result .xml files will contain the results and metadata from the test runs that we'll use with the Unity Performance Benchmark Reporter to create benchmark results and compare to subsequent test runs. |
Example: Running Performance Tests in the Unity Editor

Viewing Performance Test Results
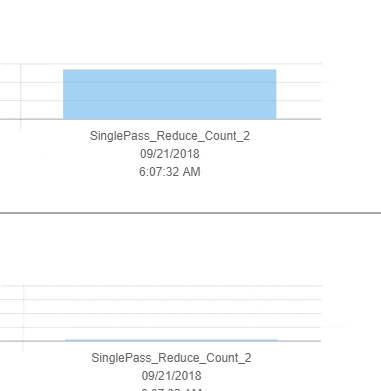
If we’re running these tests from within the editor, the aggregate values can be seen near the bottom of the Unity Test Runner window by selecting each test.
Example: Viewing Performance Test Sample Aggregations from Unity Test Runner
If you want to see the results of running your Unity Performance Tests from the command line, you’ll need to use the Unity Performance Benchmark Reporter (or just open the result .xml file, but it’s not an easy read).
With that, let’s transition to talking about how we can use the Unity Performance Benchmark Reporter to view and compare results.
Using Unity Performance Benchmark Reporter
Unity Performance Benchmark Reporter enables the comparison of performance metric baselines and subsequent performance metrics (as generated using the Unity Test Runner with the Unity Performance Testing Extension) in an html report with graphical visualizations.
The reporter is built as a .NET Core 2.x assembly so that it is compatible to run across different .NET supported platforms (Windows, OSX, etc). Therefore, to run it, you'll need to ensure you have installed the .NET Core SDK.
Executing the Unity Performance Benchmark reporter entails invoking the assembly with the dotnet command like this:
dotnet UnityPerformanceBenchmarkReporter.dll
--baseline=D:\UnityPerf\baseline.xml
--results=D:\UnityPerf\results --reportdirpath=d:\UnityPerf
After the reporter runs, a directory named UnityPerformanceBenchmark will be created with an html report and supporting .css, .js, and image files in it. Open the html report to view visualizations of the performance metrics captures in the .xml result files.
Command Line Options
--results
The path to a directory where we have one or more non-baseline result .xml files to be included in the html report.
At least one --results value must be passed to the UnityPerformanceBenchmarkReporter.dll assembly. This is the only required field.
This command line option also can be used to specify the path to a single .xml non-baseline result file. Additionally, you can specify several directories or files by repeating the option like this:
--results=D:\UnityPerf\results --results=D:\UnityPerf\results.xml
--baseline
The path to a result .xml file that will be used when comparing other results.
--reportdirpath
The path to a directory where the reporter will create the performance benchmark report. This is created in a UnityPerformanceBenchmark subdirectory.
If the report location is not specified, the UnityPerformanceBenchmark subdirectory will be created in the working directory that the UnityPerformanceBenchmarkReporter.dll was invoked.
Comparing Performance Test Results
Let’s compare some performance test results with the Performance Benchmark Reporter.
Example: Experiment with Configuration Changes in a VR-enabled Gear VR Scene to Improve Frame Rate
I have a Unity scene with the following complexity characteristics.
- 732 objects
- 95,898 triangles
- 69,740 vertices

I ran a Unity Performance Test against this scene sampling metrics that would help me understand if I could sustain close to 60 FPS using Multi Pass Stereo Rendering. Next, I ran the Performance Benchmark Reporter with the results of my test.
What I found is that my FPS is closer to 30 FPS, half of what I’d like to be at.


Next, I’m going to try using Single Pass Multiview Stereo Rendering to see how close to 60 FPS I can get. I’ll rerun my Performance Test with the configuration change, then create another Unity Performance Benchmark Report comparing my first results with the new ones.

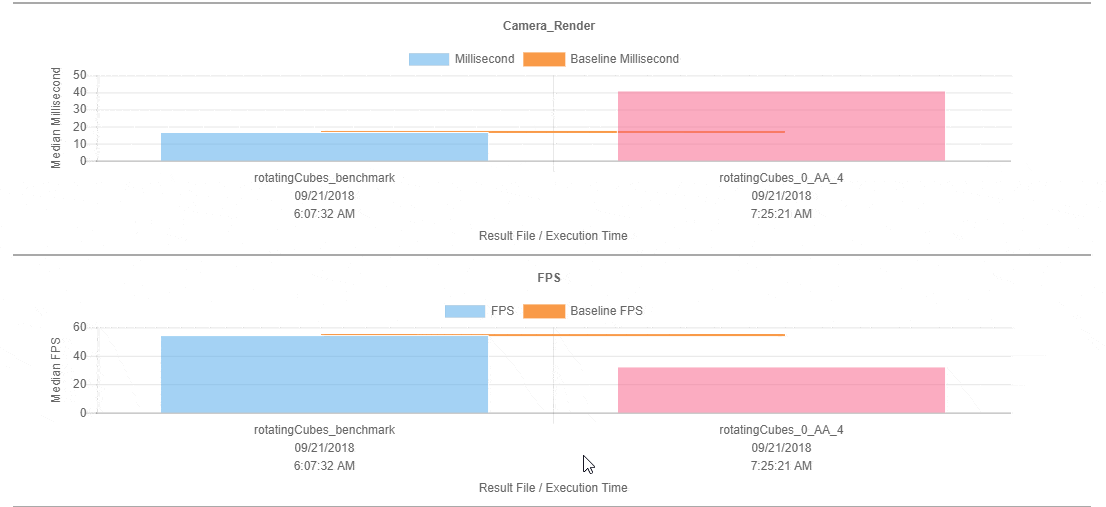
Looks like the configuration switch to Single Pass Multiview rendering improved our FPS to 37. We still need to be closer to 60 FPS if we want this scene to run without significant frame drop on Gear VR.
The last thing I’m going to experiment with is reducing the number of rotating cubes in my scene to see if we can get FPS up.
After a couple of tries I’m able to improve performance to ~55 FPS. But I had to reduce the number of object in the scene from 732 to 31. That’s quite a bit.
I’ll circle back on other improvements I can make for performance optimization, but for now, I’m going to use this as an FPS baseline. I’ll use this as my benchmark going forward, hoping to improve it if I can.
Establishing Benchmarks and Tracking Performance Changes
Establishing benchmarks can mean many things depending on your project. In this context, running performance tests in Unity, we’re talking about establishing a baseline set of results, a last-known-good set of performance metrics that we can compare subsequent results to as we make changes. These become our benchmark.
In the previous section I arrived at a configuration using Single Pass Multiview Stereo Rendering for Gear VR, and a decreased scene object count, that resulted in an “acceptable” FPS. At that point, I decide to use my test results as my benchmark. Let’s see an example of how we can use this benchmark as we make further changes to the player configuration.
Example: Use Performance Benchmark to Detect Performance Regression with Configuration Changes
I’d like to enable antialiasing in my scene to smooth the appearance out. The default Quality Settings in Unity for Android disable antialiasing, but I’d like to see if we can enable it and still maintain an acceptable FPS for our Gear VR scene.
First I set the antialiasing value in my IPrebuildSetup.Setup method to 4.
QualitySettings.antiAliasing = 4;
Next I rerun the performance test from earlier on my Gear VR-enabled Android phone. I then use the Unity Performance Benchmark Reporter to compare this new run with my newly-established benchmark results.
But look, with the reconfiguration of my Unity player to use antialiasing at level 4, my FPS dropped to 32 FPS, which is about where I originally started out when I created this scene with 732 objects.
I’d like to experiment with a few lower antialiasing values to see if I can recover an acceptable FPS for the scene before I bail on this idea. So, I try with antialiasing set to 2, and then finally 1. The results are in the image below.

In this reconfiguration scenario, using the performance benchmark I established earlier, I was able to experiment with changes in my Unity player settings and then verify the performance impacts before committing to them.
Even though I’m within my default 15% threshold of variance for FPS using antialiasing set to 1, FPS is now at 49, a bit too far from the 60 FPS for my VR-enabled scene that I’d like to be at. I don’t think I’ll commit to these changes today.
Conclusion
Unity is putting a lot of focus on great performance by default. But the Unity Engine is only part of what ultimately results in users loving to play your games, enjoying a smooth and high performance experience across all the platforms they may play on. And SDKs, drivers, or Unity packages, for example, that work great without introducing performance regressions are critical to an overall great Performance experience for everyone.
I’ve introduced you to a couple of Unity tools that make it easier to start collecting performance metrics and creating benchmarks with them: the Unity Performance Testing Extension, and the Unity Performance Benchmark Reporter. I encourage you to experiment with what they can do for you and your performance-focused efforts.
We looked at
- How we can use the Unity Test Runner to write performance tests to sample profiler and other metrics,
- Some different ways we can execute performance tests using the Unity Test Runner, and
- How to use the Unity Performance Benchmark Reporter to analyze and compare performance metrics, run over run, as you begin to up your performance testing game.
Establishing baselines for these metrics, and using them to create a benchmark for your scenes, game, SDK, driver, package, or other Unity integrations can be an effective way to start creating visibility into impacts your changes have. Good luck!
Many thanks and credit go to my Unity colleagues for their help contributing, brainstorming, experimenting, developing, and iterating on this work with me.
- Qi Jiang
- Sakari Pitkänen
- Gintautas Skersys
- Benjamin Smith
Is this article helpful for you?
Thank you for your feedback!
- Unity Labs
- Copyright © 2024 Unity Technologies