The State Of Performance Reporting II
Performance Reporting aims to be a suite of tools. At the moment, only exception reporting is available as a feature of our Performance Reporting service. This has lead to some confusion as developers often are looking for profiling data. In the future, we see Performance Reporting becoming a suite of tools for things like benchmarking and getting some lightweight profiling data.
How Performance Reporting fits in with Analytics, Cloud Build, and Collaborate
We often get questions about how Performance Reporting works with our other Unity Services. Our vision is clear, and we would like to share it with you now.
Analytics
Analytics is about helping developers understand their players. Performance Reporting is about improving the health of your game. By bringing these two together, we can see how bugs impact your players.
In the future, you’ll be able to cross reference game session data with exceptions. With this, we can correlate an increase in exceptions with the end of a session.
Cloud Build
Cloud Build is all about automating your build process so you can focus on your game. Performance Reporting's most requested feature is Native crashes. One struggle for native crash support is getting the build symbols, so that the native crash reports are readable by humans.
Again, by bringing these two together, we can give you native crashes just by turning both the services on. The future we see here is native crashes with two clicks. Just enable Cloud Build and Performance Reporting.
Collaborate
Collaborate is all about seamlessly working on your project with a team. Part of good collaboration is having a clear overview of bugs that currently exist in your project. Performance Reporting will be able to use Collaborate's project history to help narrow down where and when a bug was introduced.
Performance Reporting is now integrated into the editor
Previously, it took some effort to get started with Performance Reporting. These were the steps our beta users went through:
- Learn the feature existed
- Go to the website
- Download the package
- Install the package
- Get your project ID
- Add a few lines of code to your project
While we did our best to simplify this, it was still too hard.
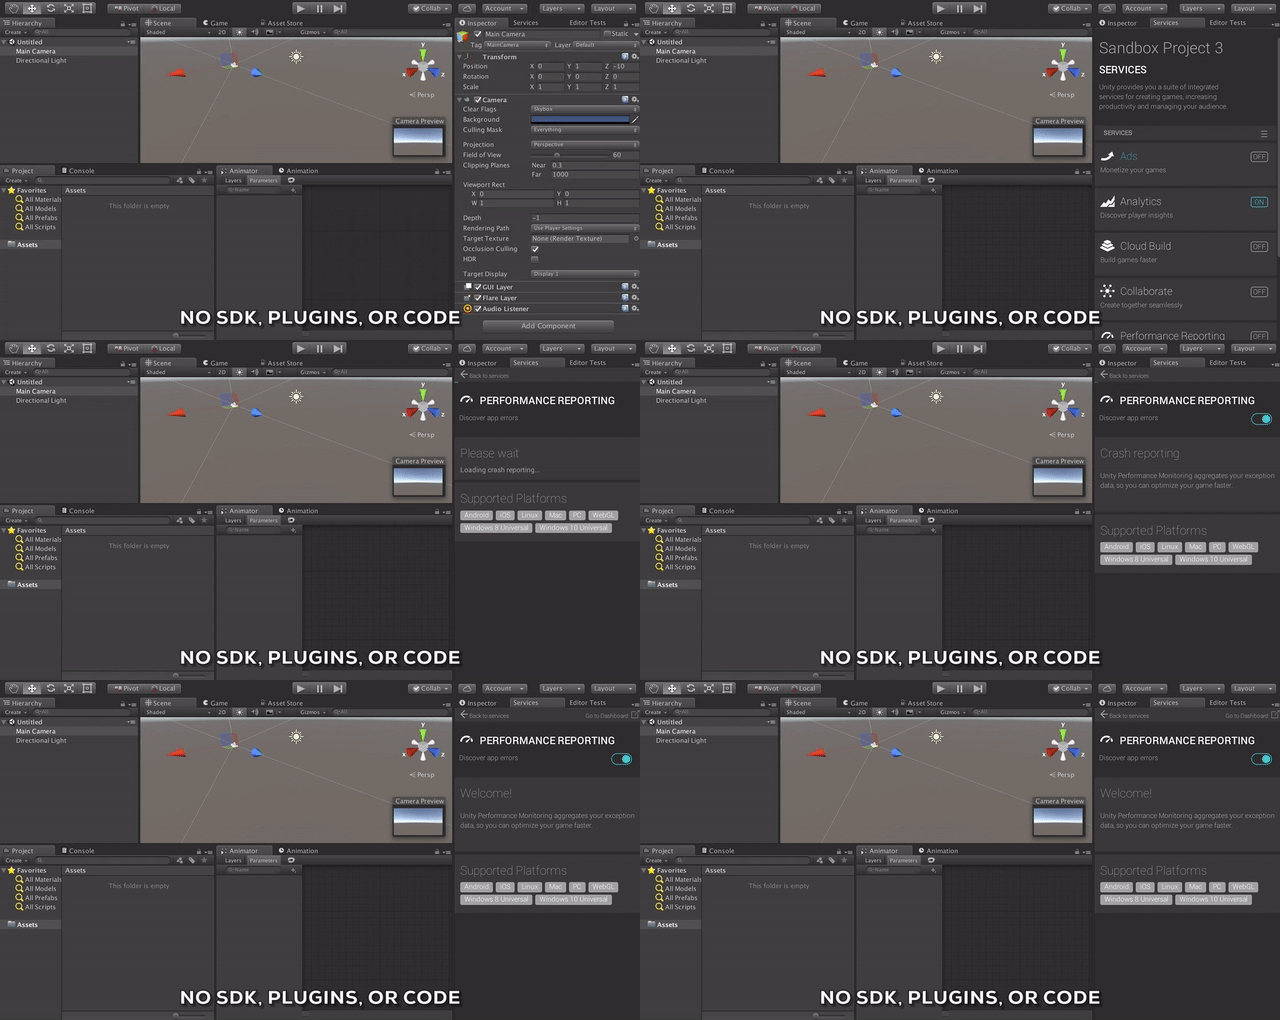
We're pleased to announce that in Unity Pro 5.4, new projects can enable Performance Reporting with one click.

The work here mostly involved translating C# into C++ , refining our algorithm for sending data and moving from the Unity WWW class to the UnityWebRequest class.
How the Performance Reporting client works
Performance Reporting sends reports with a behavior that works like this:
- A map between fingerprint and exception is stored.
- An exception comes in and gets fingerprinted.
- If the fingerprint isn't in the map, it is added, then an asynchronous HTTPS request is scheduled for that report ensuring PerfRep gets at least one report.
- If the fingerprint already exists in the map, a counter is incremented.
- If too many of the same exception have been observed (10,000), the data is flushed asynchronously via HTTPS, and the feature breaker trips for the session.
- If too many different exceptions have been observed (100), the data is flushed asynchronously via HTTPS, and the feature breaker trips for the session.
- When the client exits the game, the data is flushed asynchronously via HTTPS to the server.
When the feature breaker trips, we unregister the log callback so we don't get any more reports this play through. Relaunching the game will start sending new reports. Usually when you reach one of these limits, you hit one of these cases:
- There is an exception in the update loop.
- A message that is variable with something like a time stamp, url with a query string, or temporary file name.
One challenge was the exit hook. Some platforms don't give you any time; others do. The Desktop platforms will successfully send their final counts, but that might not always be the case with iOS.
Upgrading from the Performance Reporting Plugin
If you’re using Performance Reporting for a 5.3 or earlier project, upgrading from the plugin to native editor is pretty straight forward. Just remove the package and any code you have referencing it, such as the initializing code. Then go to the Unity Services window shown above and click enable.
If you don't remove the plugin, the new method will still work. However, both the plugin and editor integration will send a report, causing double counting and extra network traffic.
Performance Reporting Roadmap
The feedback we've gotten has been remarkably consistent. Developers want native crashes, and some more filtering and tagging options for the dashboard.
The good news is that we should have some better filtering options for the dashboard SoonTM. The also good, but never soon enough news, is that native crashes will probably be in 5.5 for iOS with other platforms to follow. Native crashes are a platform by platform battle, and we will do our best to get the ones we can into 5.5.
Another shift for Performance Reporting will be the what we're calling the "Common Data Pipeline". This is a platform that the editor will use to minimize network connections and link information between services.
Is this article helpful for you?
Thank you for your feedback!
- Unity Labs
- Copyright © 2024 Unity Technologies