Frame Debugger in Unity 5.0


Have you ever looked at some graphics issue in Unity, and thought “if only I could see how the final frame is rendered, step-by-step?”. I know I do want that, all the time.
You can achieve that with some external tools, especially if you’re on Windows. Build a standalone player, run it through Visual Studio graphics debugger, Intel GPA, RenderDoc, NVIDIA NSight or AMD GPU PerfStudio, then capture a frame of rendering, and step through the draw calls and other rendering events to see what’s going on.
The above is a very powerful approach, since these tools can provide you with a lot of information to really drill down. It’s also very involved; you need to build a player and launch external tool.
During one hack week we thought: “hey, can we build something really simple, but really quick to use in Unity?”... So we did.
Enter Frame Debugger
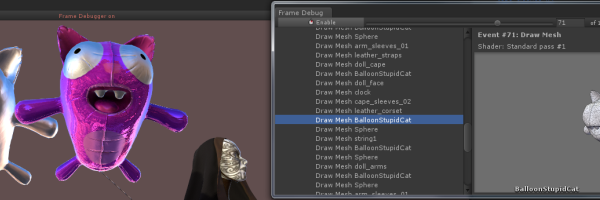
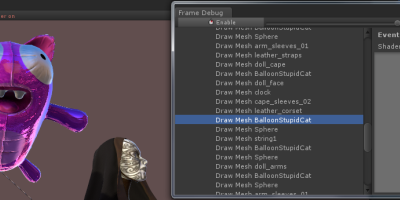
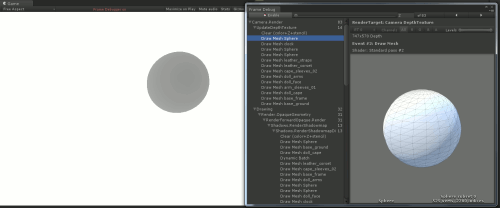
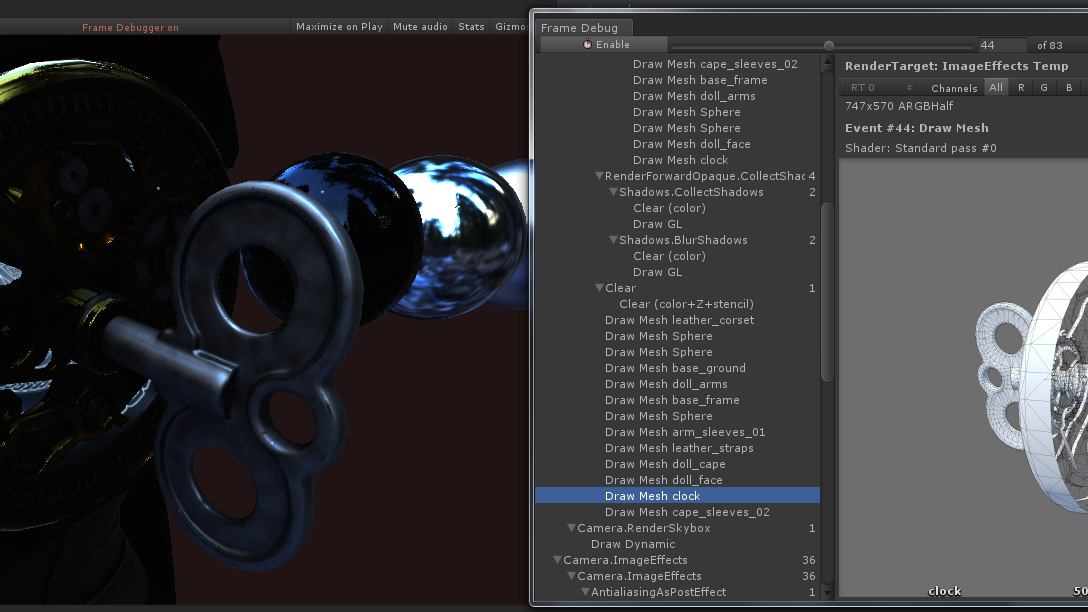
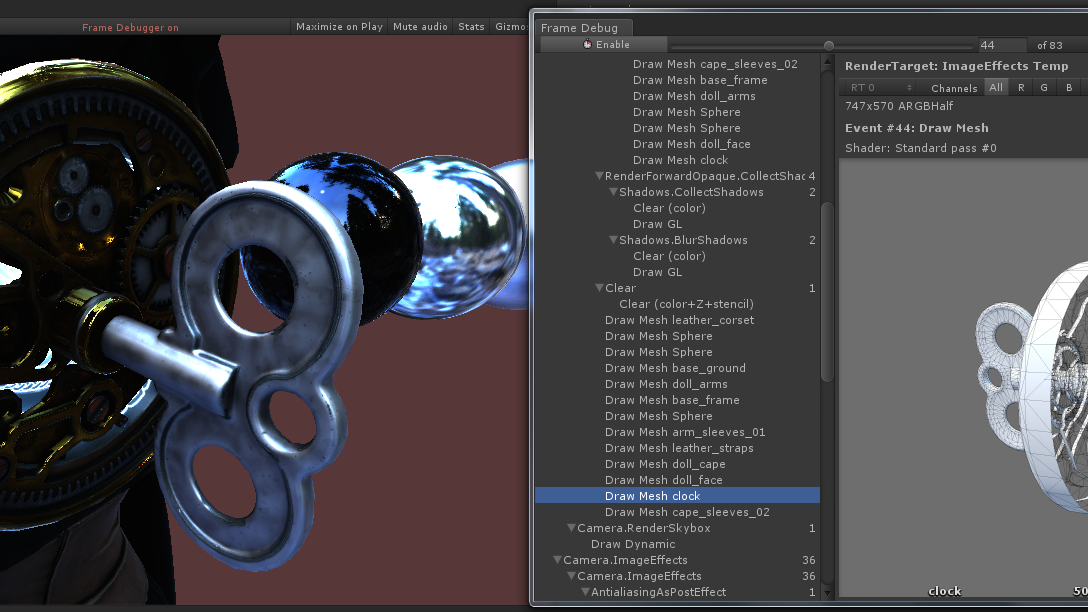
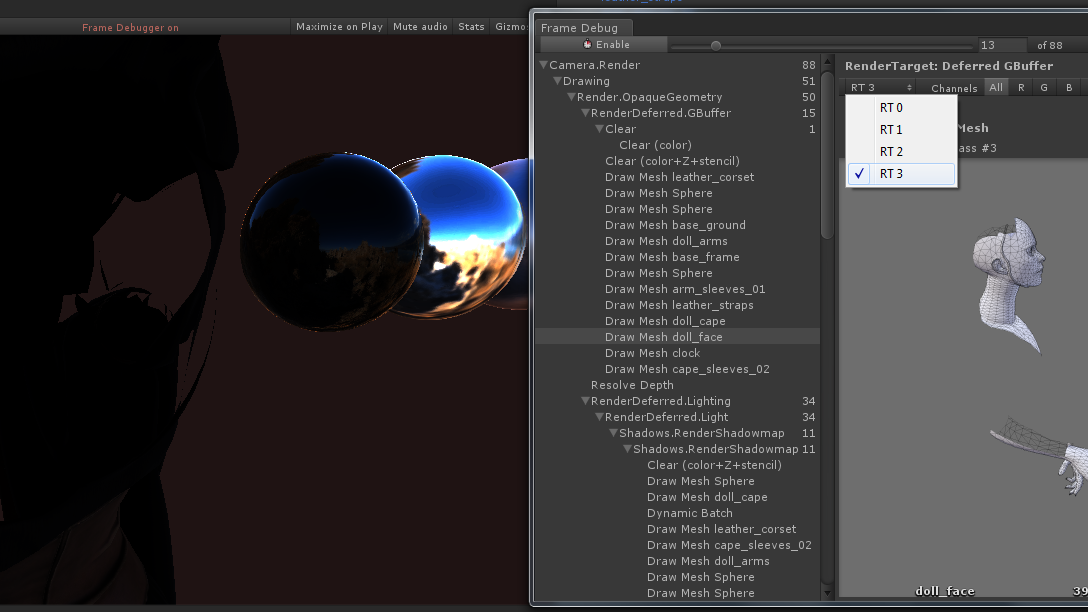
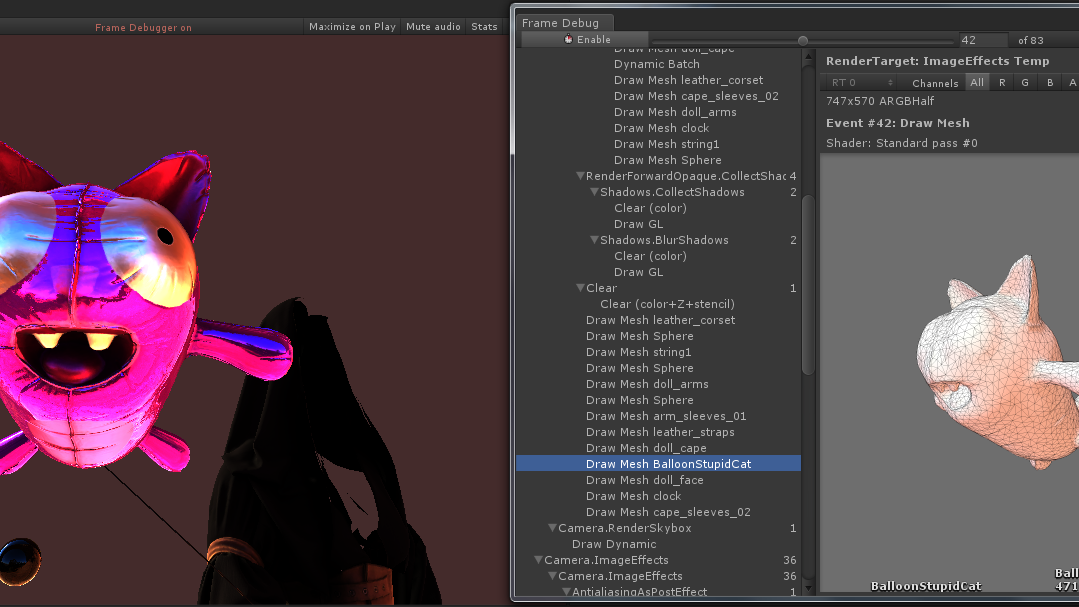
You select Frame Debugger from the Window menu and you see a list of draw calls made during that frame. Step through them and see what was rendered up to that point. Inspect shadow maps, temporary render textures, deferred g-buffer and whatnot.

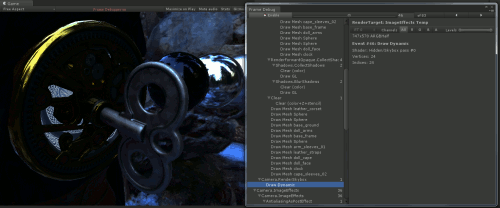
The UI for the frame debugger is pretty simple. There’s a tree of draw calls and other interesting events on the right and details about selected event on the left. Most draw calls display a mesh preview and highlight object being drawn in the hierarchy.
Here we are stepping through the draw calls of depth texture creation, in glorious animated GIF form:
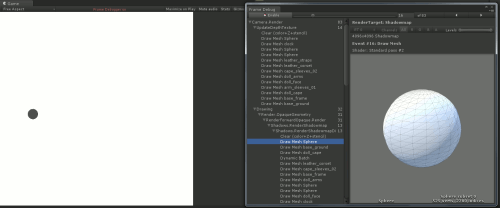
And later on in the frame, a light is rendering it’s shadow map:
Even later on, image post-processing effects start. You can see the bloom & flares effect downscaling the image, blurring it and adding it back, followed by a brief flash of a tonemapper:
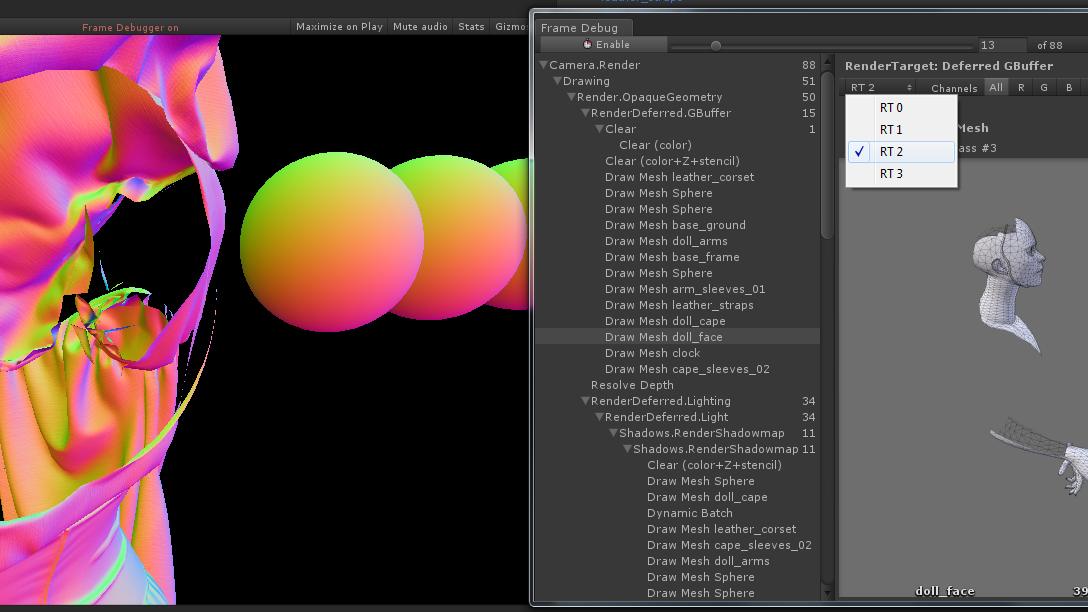
Render target display options
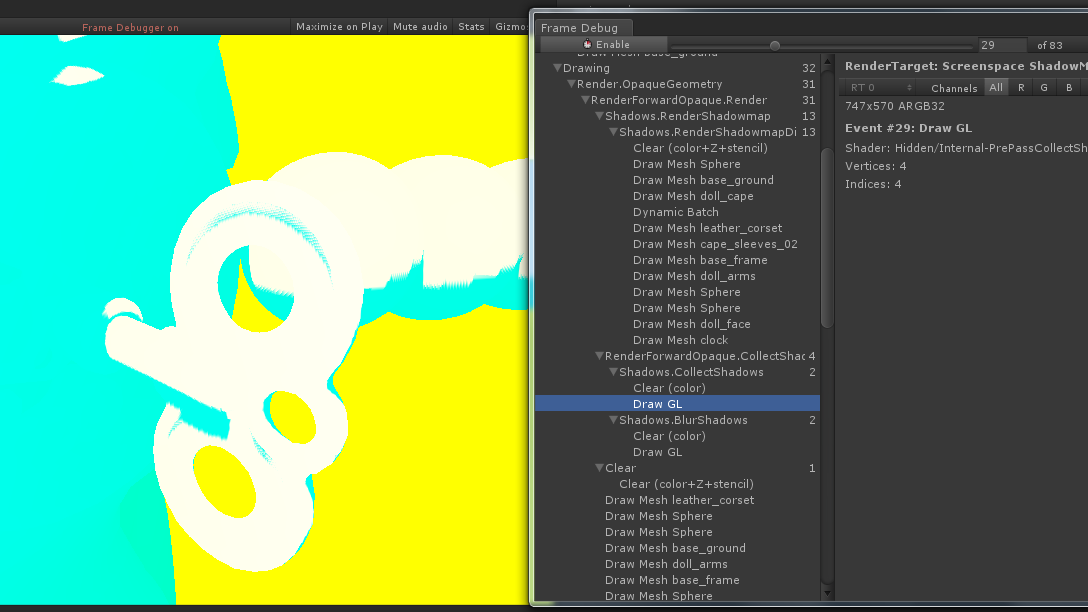
For some effects, it is convenient to see individual channels of a render target. Here’s a screenspace buffer produced by Unity’s directional light shadows:
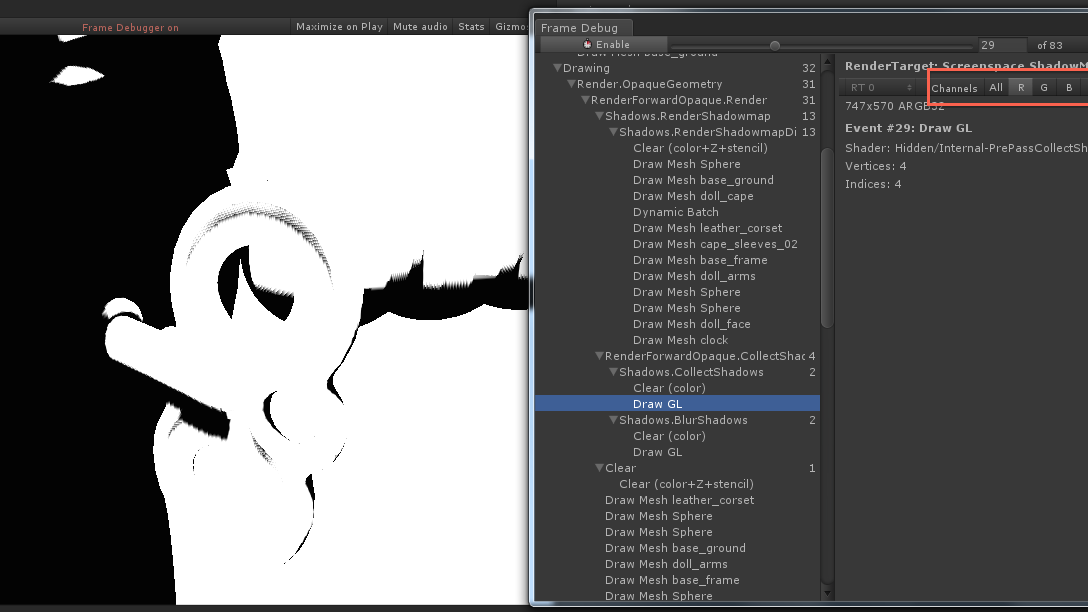
And here's only the red channel displayed:
The range of colors displayed can be tweaked via a Levels slider in the toolbar. This is particularly useful for HDR rendering:
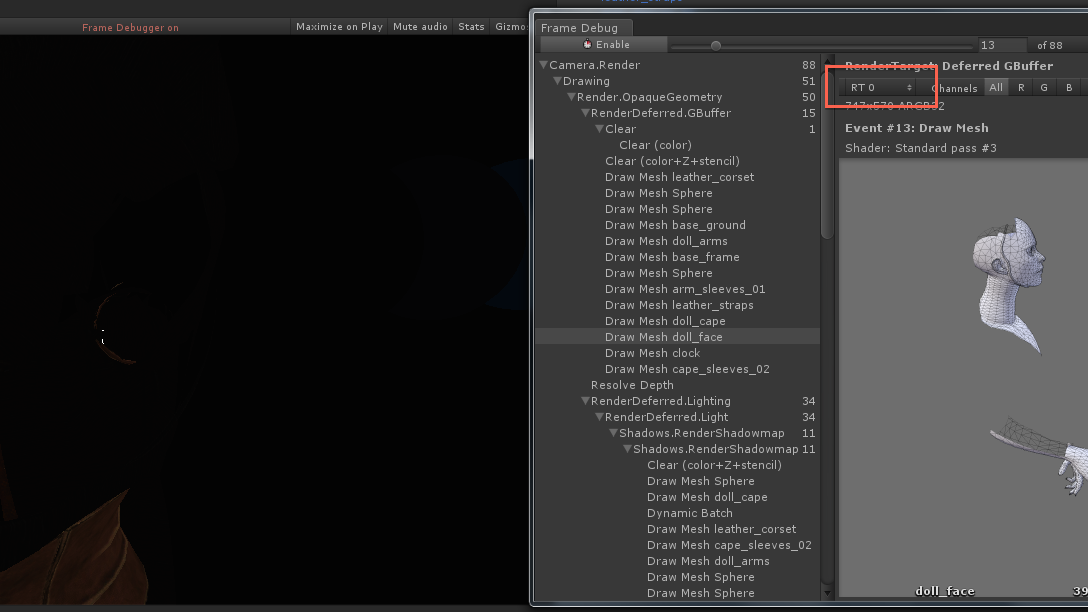
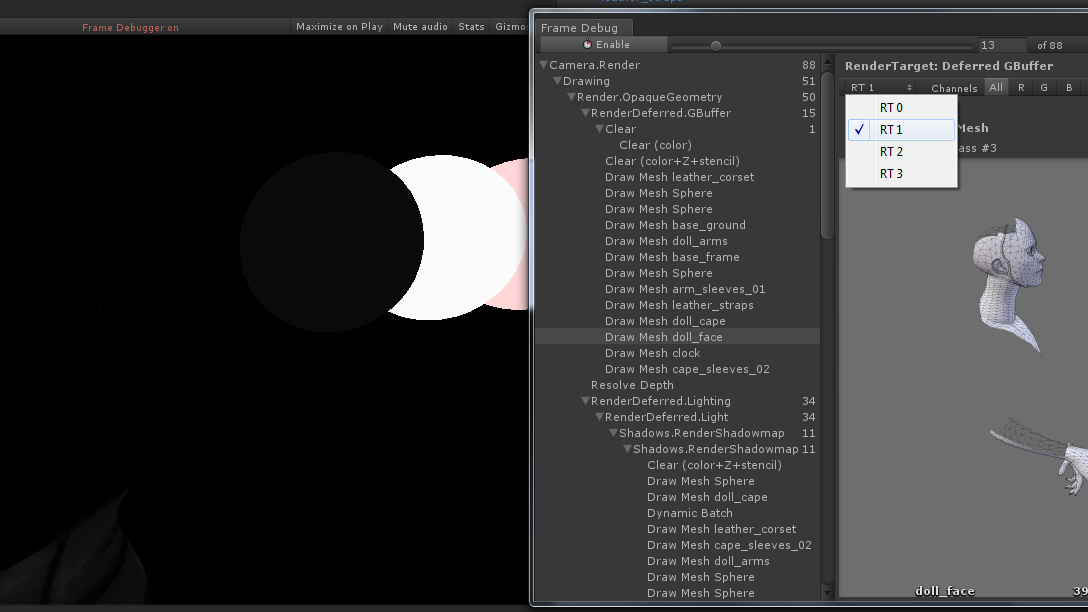
When rendering into multiple render targets at once you can select which one to display in the game view. Shown here are the diffuse, specular, normals and emission/lighting buffers in 5.0 deferred shading mode, respectively:

Is this article helpful for you?
Thank you for your feedback!
- Unity Labs
- Copyright © 2024 Unity Technologies